
Kafka client's metrics & prometheus
Proof of concept: jmx-exporter and kafka clients.
Main idea: expose JMX metrics of applications which use Apache Kafka APIs.
Jmx exporter requires config patterns.
https://github.com/zhenik/kafka-clients_metrics-tracing
Approaches:
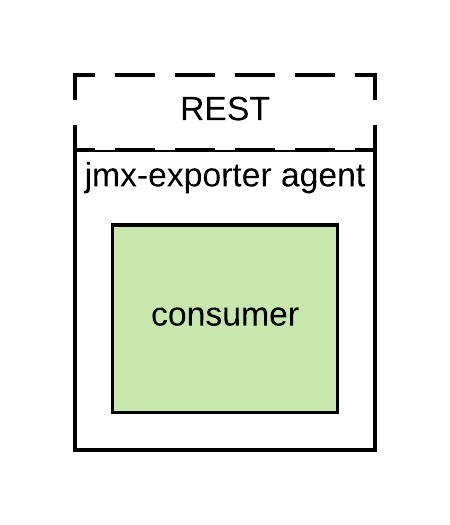
1. Application coupled with java agent. This approach sort of standalone mode. Reference
2. Application + Exporter(side-car).
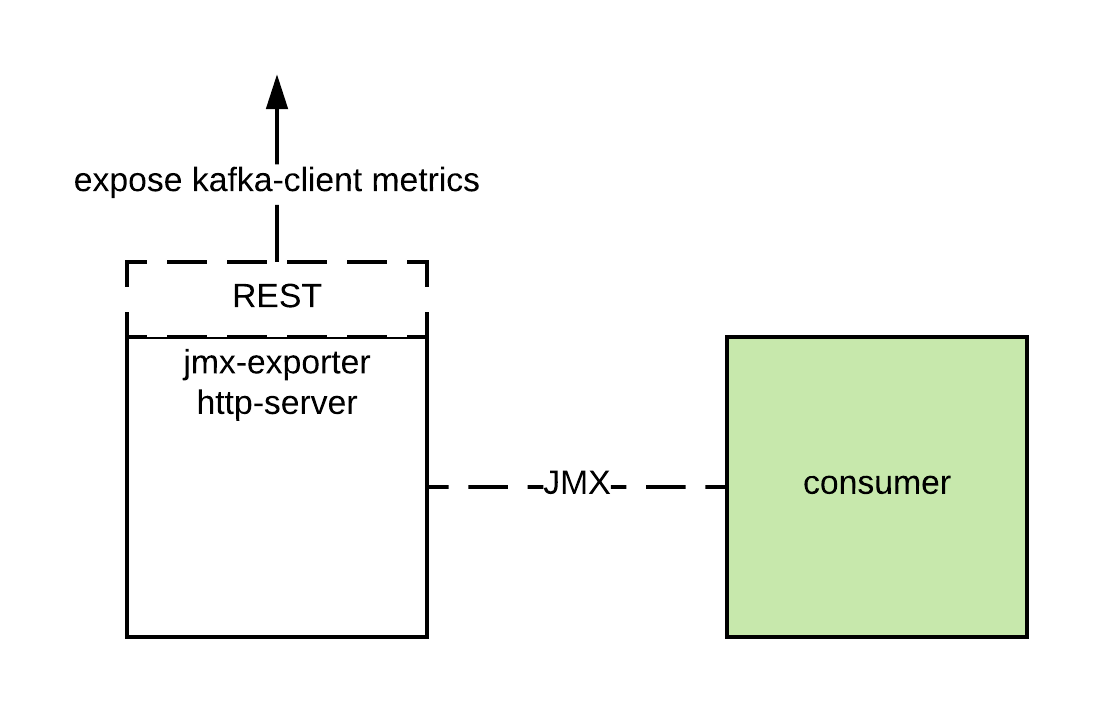
There is need to run application with several parameters to be able expose JMX metrics from application.
Here I provide Dockerfile with env variables:
FROM openjdk:8-jdk-stretch
COPY ./target/producer-metrics-1.0-SNAPSHOT.jar .
CMD java -Dcom.sun.management.jmxremote \
           -Dcom.sun.management.jmxremote=true \
           -Dcom.sun.management.jmxremote.local.only=false \
           -Dcom.sun.management.jmxremote.authenticate=false \
           -Dcom.sun.management.jmxremote.ssl=false \
           -Djava.rmi.server.hostname=$HOST \
           -Dcom.sun.management.jmxremote.host=$HOST \
           -Dcom.sun.management.jmxremote.port=$JMX_PORT \
           -Dcom.sun.management.jmxremote.rmi.port=$JMX_PORT \
           -jar producer-metrics-1.0-SNAPSHOT.jar kafka:9092
3. Application on Dropwizard with custom metrics + Exporter(side-car)
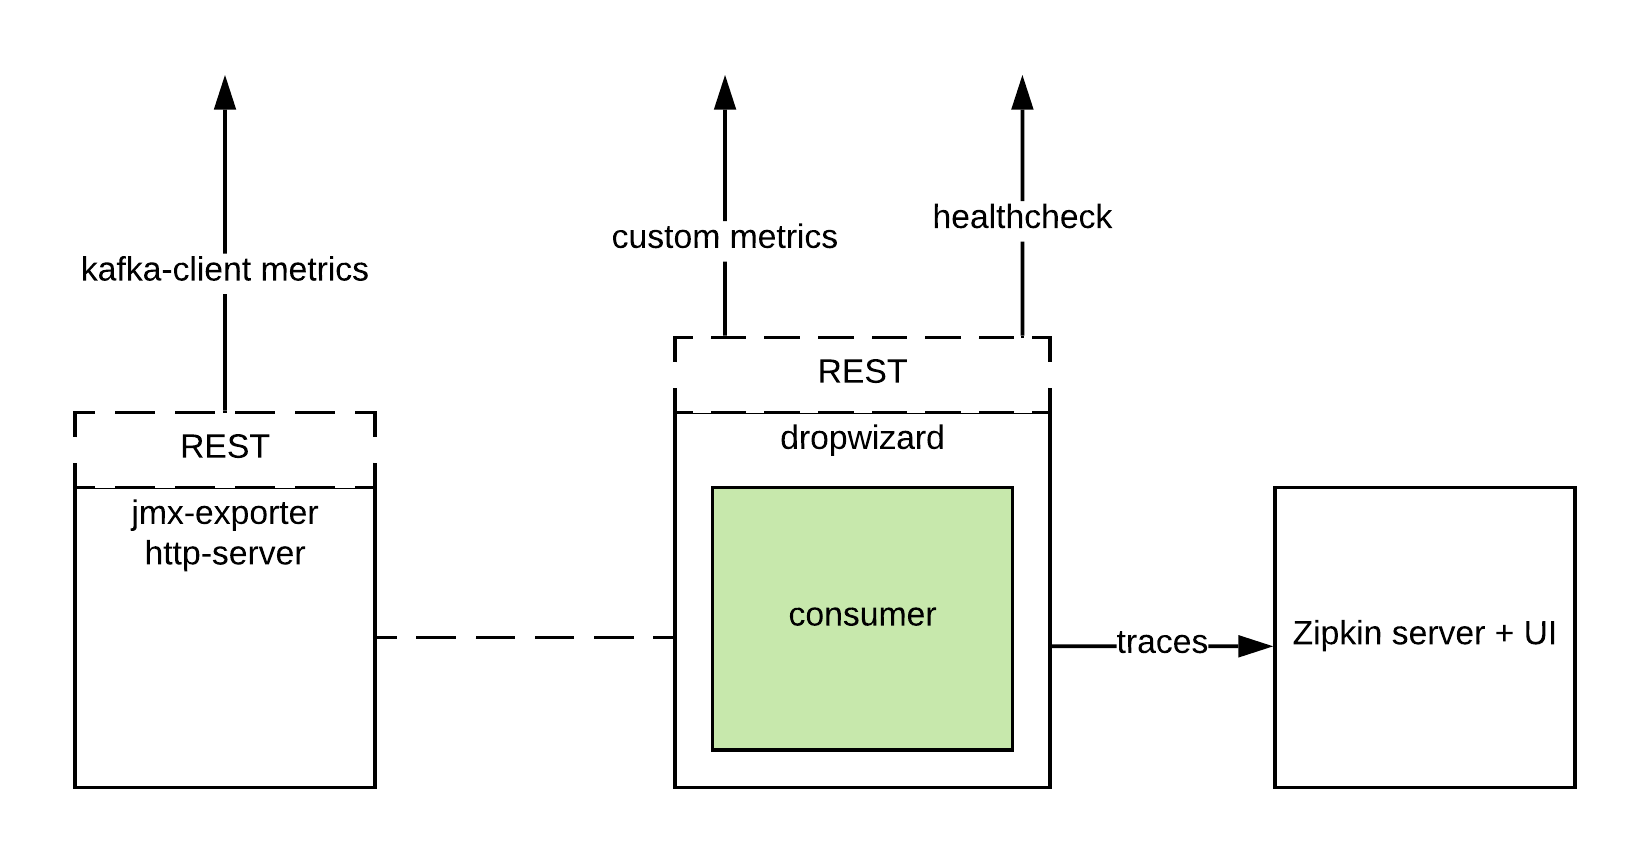 To expand metrics I use Dropwizard framework and prometheus client for dropwizard.
// Create registry for Dropwizard metrics.
MetricRegistry metrics = new MetricRegistry();

// Create a Dropwizard counter.
Counter counter = metrics.counter("my_custom_counter_total");

CollectorRegistry.defaultRegistry
    .register(new DropwizardExports(metrics));

/** prometheus + dropwizard metrics are available
*   on localhost:8081/prometheus/metrics
*/
environment.getAdminContext()
    .addServlet(new ServletHolder(
        new MetricsServlet()), "/prometheus/metrics");

// Add metrics about CPU, JVM memory etc.
DefaultExports.initialize();

// use
counter.inc();
Written on April 8, 2019